Dashboard
The vRealize Orchestrator Client dashboard provides a useful tool for monitoring, managing, and troubleshooting vRealize Orchestrator Client workflows s.
Information on the vRealize Orchestrator Client dashboard is spread among five panels.
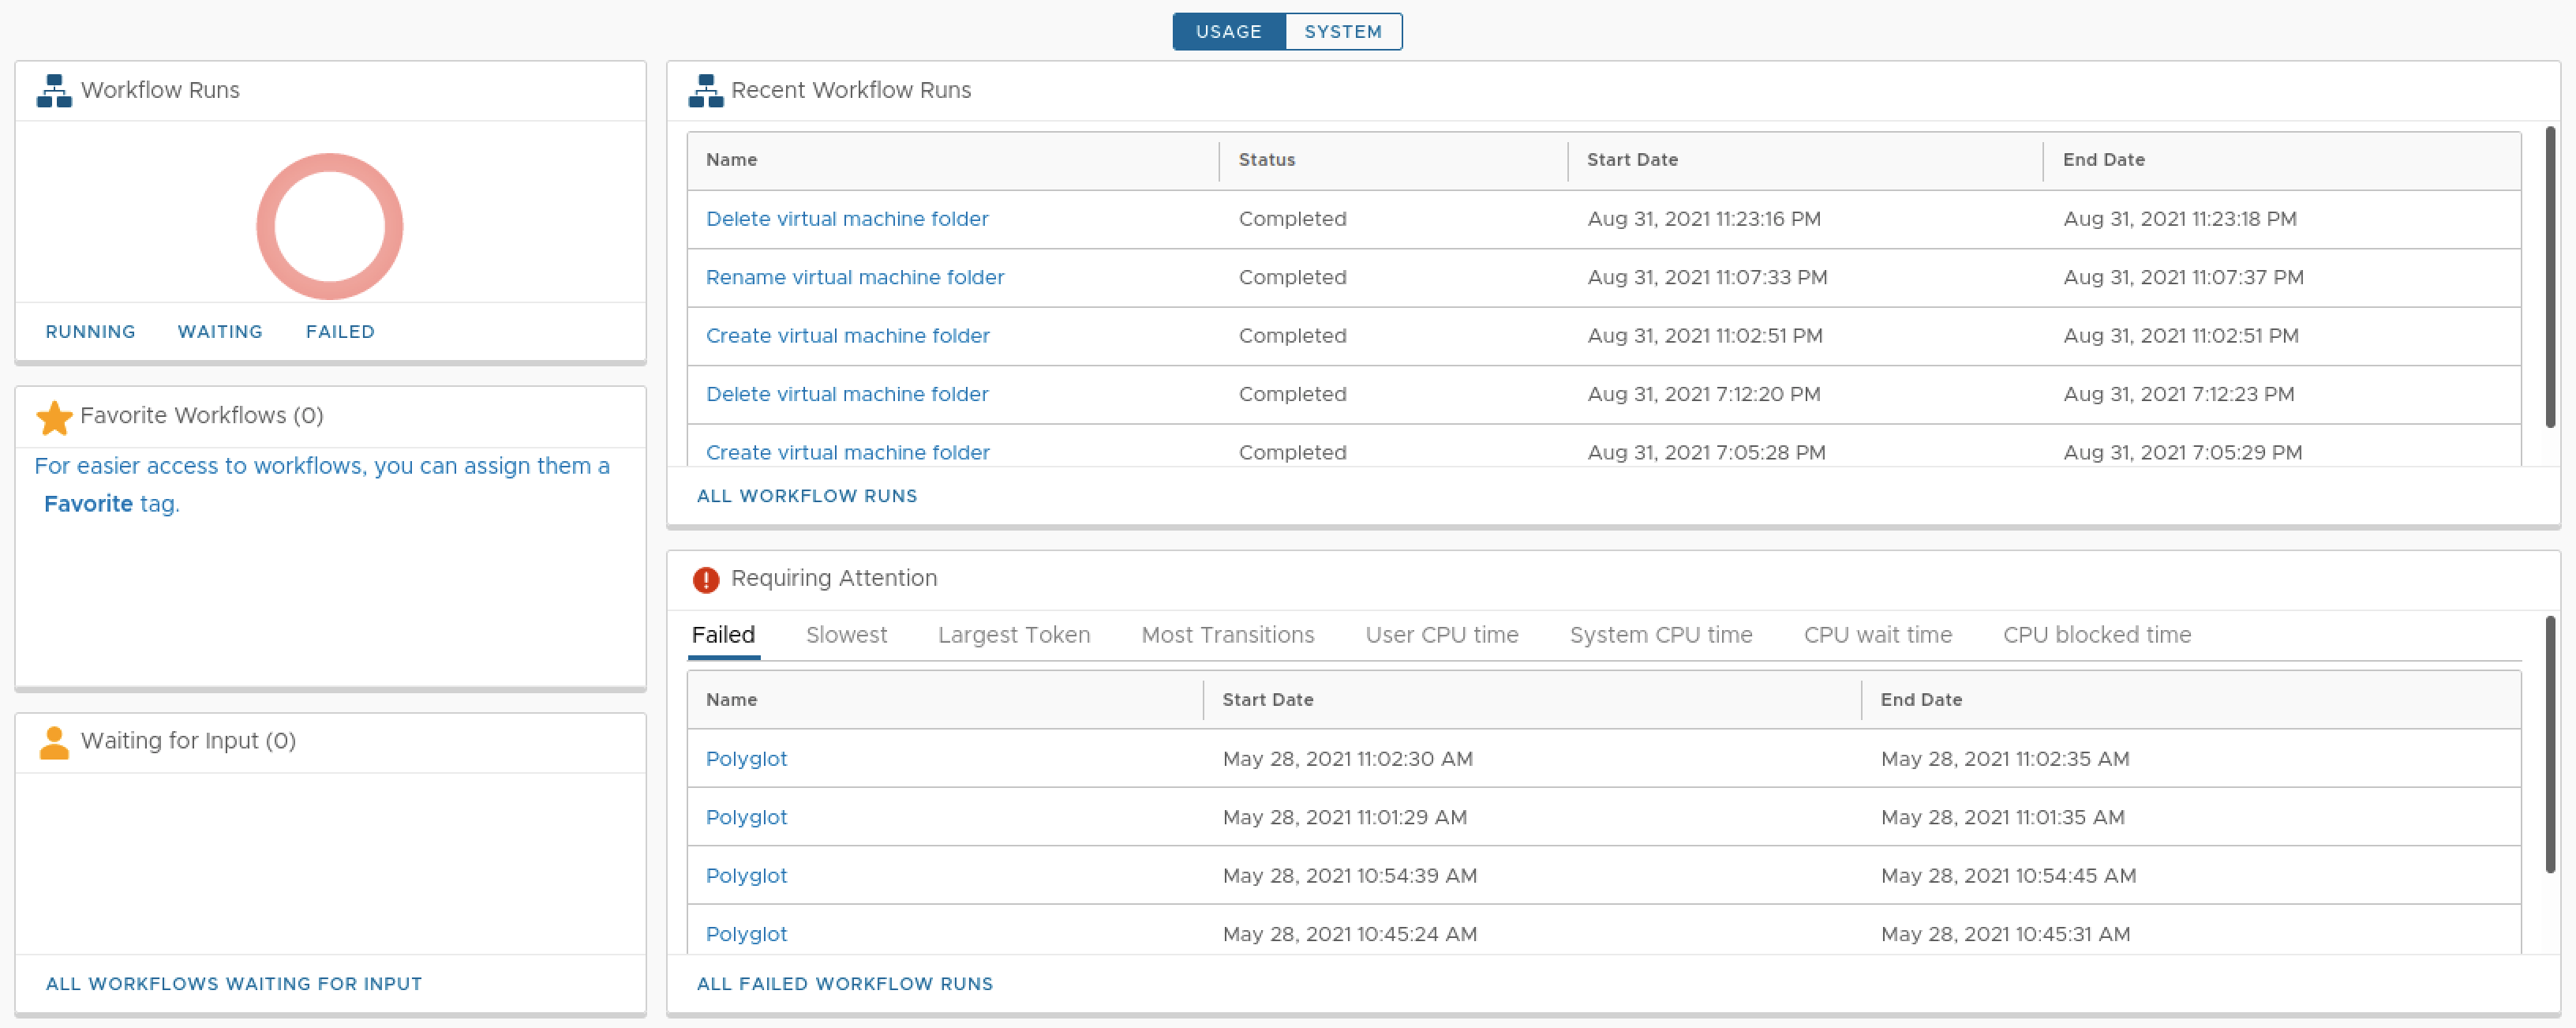
- Workflow runs, provides visual data about the number of running, waiting, and failed workflow runs.
- Favorite workflows, displays workflows added to favorites.
- Waiting for input, displays pending workflow runs that require further user interaction. These workflows are also displayed in the notifications menu in the upper-right corner of the UI.
- Recent workflow runs, Manage recent workflow runs. Shows the name, state, start date, and end date of the workflow run.
- Requiring Attentions, displays failed workflow runs and workflow run performance metrics.
Use the vRealize Orchestrator Client Dashboard and profiling feature to gather useful metric data about your vRealize Orchestrator environment and workflows .